Peak Coverage
Draw peak on Hi-C contact matrix.
[1]:
import coolbox
from coolbox.api import *
[2]:
coolbox.__version__
[2]:
'0.4.0'
HiCPeaks Coverage accept bedpe format:
[3]:
test_cool = "../../../tests/test_data/cool_chr9_4000000_6000000.mcool"
test_peak = "../../../tests/test_data/peak_chr9_4000000_6000000.bedpe"
[4]:
frame = XAxis() + \
Cool(test_cool, cmap="JuiceBoxLike") + \
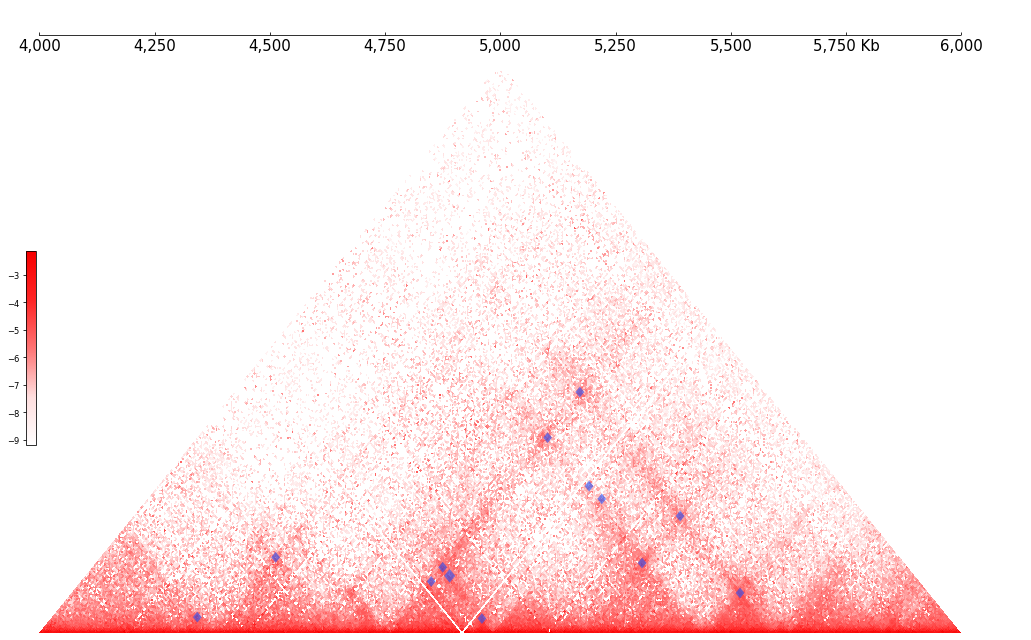
HiCPeaksCoverage(test_peak, color="#2255ff", line_width=5)
[5]:
frame.plot("chr9:4000000-6000000")
[5]:
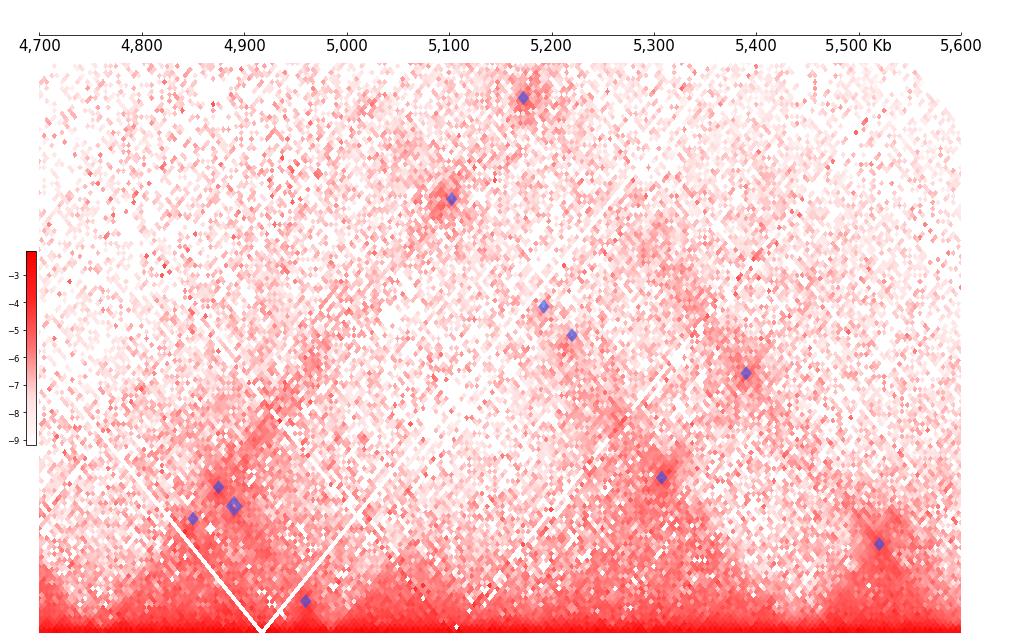
[6]:
frame.plot("chr9:4700000-5600000")
[6]:
Parameters:
[7]:
print(HiCPeaks.__doc__)
Hi-C Peaks(Loops) from .bedpe file. Used to show the peaks on the Hi-C interaction map.

Parameters
----------
file: str
    Path of .bedpe file
pos : str, optional
    Method for choosing arch anchor for bedpe data: 'start', 'end', 'mid', default 'mid'
style : str, optional
    Style of arcs plot: 'arcs', 'hicpeaks', default 'arcs'
score_to_width : str, optional
    Mapping function of score to width, default: '0.5 + math.sqrt(score)'
line_width : float, optional
    Width of arc line.
open_region : bool, optional
    If specified to True, will fetch the contacts on side in the region,
    default True
diameter_to_height : str, optional
    Mapping function of arc diameter(interval end - start) to height.
    You can specify to 'max_diameter' let all arcs has same height.
    default 'max_height * diameter / max_diameter'.
orientation : str, optional
    Track orientation, use 'inverted' for inverted track plot. default None
line_style : str, optional
    Border line style, default 'solid'
fill : bool, optional
    Fill center or not, default False.
fill_color : str, optional
    Fill color, use 'rgb' for specify color in file,
    default 'rgb'.
fill_alpha : float, optional
    Alpha value of fill region.
    default 0.2
side : {'upper', 'lower', 'both'}
    Plot peak in which side of the matrix.
    NOTE: This parameters is useful only if the Cool track in matrix format.
alpha : float, optional
    Alpha value of track, default 0.8.
properties_dict : dict
    The properties(features) of this track. For example 'height', 'color'...
name : str, optional
    The name of Track.
    (Default: "{self.__class__.__name__}.{self.__class__._counts}")
title : str, optional
    Title of ax
height : int, optional
    Height of ax
color : str, optional;
    Color of ax

Attributes
----------
properties : dict
    The properties(features) of this track. For example 'height', 'color'...
name : str
    The name of Track.
coverages : list of `coolbox.api.coverage.Coverage`
    Coverages on this Track.
CLI code
[8]:
%%bash

coolbox add XAxis - \
add Cool ../../../tests/test_data/cool_chr9_4000000_6000000.mcool - \
add HiCPeaksCoverage ../../../tests/test_data/peak_chr9_4000000_6000000.bedpe - \
goto "chr9:4700000-5600000" - \
plot /tmp/test_coolbox_hicpeak.png