Ideogram
Plot the chromosome ideograme track.
Input file can be download from the UCSC Table Browser CytoBandIdeo table (in “all table” group). See this link
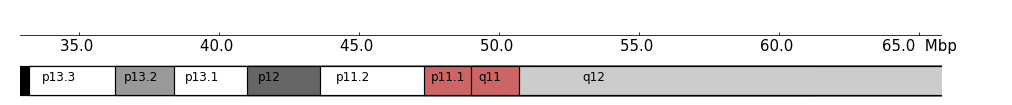
[1]:
import coolbox
from coolbox.api import *
[2]:
coolbox.__version__
[2]:
'0.4.0'
[3]:
example_file = "../../../tests/test_data/hg19_ideogram.txt"
region = "chr9:32906246-65812491"

frame = XAxis() + Ideogram(example_file)
frame.plot(region)
[3]:
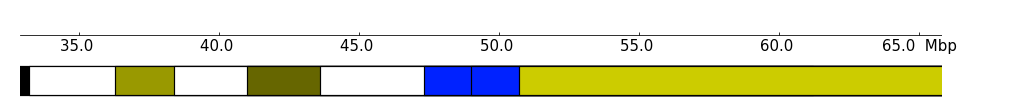
Use show_band_name can turn off the band name draw:
[4]:
frame = XAxis() + Ideogram(example_file, show_band_name=False)
frame.plot(region)
[4]:
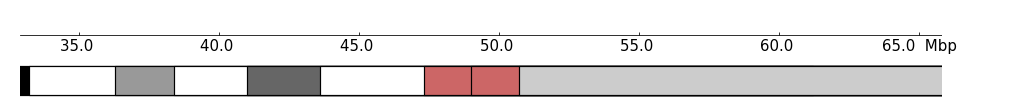
The color scheme can be changed with color_scheme parameter, the default color_scheme stored in:
[5]:
Ideogram.DEFAULT_COLOR_SCHEME
[5]:
{'gneg': '#ffffff',
 'gpos25': '#999999',
 'gpos50': '#666666',
 'gpos75': '#333333',
 'gpos100': '#000000',
 'acen': '#cc6666',
 'gvar': '#cccccc',
 'stalk': '#e5e5e5'}
We can use another scheme, by passing the color_scheme parameter:
[6]:
my_scheme = {
    'gneg': '#ffffff',
    'gpos25': '#999900',
    'gpos50': '#666600',
    'gpos75': '#333300',
    'gpos100': '#000000',
    'acen': '#0022ff',
    'gvar': '#cccc00',
    'stalk': '#e5e500'
}
frame = XAxis() + Ideogram(example_file, show_band_name=False, color_scheme=my_scheme)
frame.plot(region)
[6]: