Quickstart (CLI)
This document is for teach the basic usage of CoolBox’s Command Line Interface.
Interactive online version: binder
CoolBox CLI is a chainable command tool which can compose complex frame as easily with very intuition syntax.
Check the basic information
Firstly, check the coolbox version:
[1]:
%%bash

coolbox version
0.4.0
CoolBox CLI is composed by many chainable sub-commands, we can print the help information to list them:
[2]:
%%bash

coolbox
NAME
    coolbox - CoolBox Command Line Interface

SYNOPSIS
    coolbox - GROUP | COMMAND | VALUE

DESCRIPTION
    You can use this cli to create coolbox browser instance,
    visualize your data directly in shell.

    example:

    1. Draw tracks within a genome range, save figure to a pdf file:

        $ coolbox add XAxis - add BigWig test.bw - goto "chr1:5000000-6000000" - plot test.pdf

    2. Generate a notebook and run jupyter to open browser:

        $ coolbox add XAxis - add BigWig test.bw - goto "chr1:5000000-6000000" - run_jupyter

    3. Run a independent web application.

        $ coolbox add XAxis - add BigWig test.bw - goto "chr1:5000000-6000000" - run_webapp

GROUPS
    GROUP is one of the following:

     current_range

     frames

COMMANDS
    COMMAND is one of the following:

     add
       Add a Element(Track, Coverage, Feature), for example: coolbox add XAxis

     end_with
       End the with block

     gen_notebook
       Generate The notebook contain codes for run coolbox browser.

     goto
       Goto a genome range.

     joint_view
       Start a new frame positioned at the specified frame_pos in the final joint view. The center frame should be a single Cool, HicMat, DotHic track.

     load_module
       Import custom tracks from a module/package for example:

     plot
       Draw a figure within a genome range and save to file

     print_source
       Print the browser composing code.

     run_jupyter
       Create a notebook according to command line, then start a jupyter process.

     run_webapp
       Run a independent coolbox browser web app. (Create notebook and run voila)

     set_genome
       Set reference genome for browser object.

     show_doc
       Print the document of specified Element type. For example: coolbox show_doc Cool

     source

     start_with
       Start a 'with' block, apply the element to all elements within the block.

     version
       print coolbox version

VALUES
    VALUE is one of the following:

     frame_pos

     genome
Example Dataset
Here, we use a small testing dataset for convenient. This dataset contains files in differnet file formats, and they are in same genome range(chr9:4000000-6000000) of a reference genome (hg19).
[3]:
%%bash

echo Current working directory: $PWD
Current working directory: /mnt/c/Users/wzxu/Desktop/CoolBox/docs/source
[4]:
%%bash

ls -lh ../../tests/test_data
total 99M
-rwxrwxrwx 1 wzxu wzxu 787K Feb 26  2025 bam_chr9_4000000_6000000.bam
-rwxrwxrwx 1 wzxu wzxu 5.8K Nov  4 23:13 bam_chr9_4000000_6000000.bam.bai
-rwxrwxrwx 1 wzxu wzxu 1.5K Feb 26  2025 bed6_chr9_4000000_6000000.bed
-rwxrwxrwx 1 wzxu wzxu  449 Nov  4 23:10 bed6_chr9_4000000_6000000.bed.bgz
-rwxrwxrwx 1 wzxu wzxu  220 Nov  4 23:10 bed6_chr9_4000000_6000000.bed.bgz.tbi
-rwxrwxrwx 1 wzxu wzxu 2.3K Feb 26  2025 bed9_chr9_4000000_6000000.bed
-rwxrwxrwx 1 wzxu wzxu 8.6K Feb 26  2025 bed_chr9_4000000_6000000.bed
-rwxrwxrwx 1 wzxu wzxu 2.0K Nov  4 23:10 bed_chr9_4000000_6000000.bed.bgz
-rwxrwxrwx 1 wzxu wzxu  226 Nov  4 23:10 bed_chr9_4000000_6000000.bed.bgz.tbi
-rwxrwxrwx 1 wzxu wzxu  34K Feb 26  2025 bed_chr9_4000000_6000000_chromstates.bed
-rwxrwxrwx 1 wzxu wzxu 5.0K Nov  4 23:10 bed_chr9_4000000_6000000_chromstates.bed.bgz
-rwxrwxrwx 1 wzxu wzxu  399 Nov  4 23:10 bed_chr9_4000000_6000000_chromstates.bed.bgz.tbi
-rwxrwxrwx 1 wzxu wzxu  19K Feb 26  2025 bedgraph_chr9_4000000_6000000.bg
-rwxrwxrwx 1 wzxu wzxu 4.1K Nov  4 23:13 bedgraph_chr9_4000000_6000000.bg.bgz
-rwxrwxrwx 1 wzxu wzxu 4.5K Nov  4 23:13 bedgraph_chr9_4000000_6000000.bg.bgz.tbi
-rwxrwxrwx 1 wzxu wzxu  270 Feb 26  2025 bedpe_chr9_4000000_6000000.bedpe
-rwxrwxrwx 1 wzxu wzxu  149 Nov  4 23:09 bedpe_chr9_4000000_6000000.bedpe.bgz
-rwxrwxrwx 1 wzxu wzxu  158 Nov  9 19:55 bedpe_chr9_4000000_6000000.bedpe.bgz.px2
-rwxrwxrwx 1 wzxu wzxu  366 Feb 26  2025 bedpe_var_chr9_4000000_6000000.bedpe
-rwxrwxrwx 1 wzxu wzxu  165 Nov  4 23:23 bedpe_var_chr9_4000000_6000000.bedpe.bgz
-rwxrwxrwx 1 wzxu wzxu  173 Nov  9 19:53 bedpe_var_chr9_4000000_6000000.bedpe.bgz.px2
-rwxrwxrwx 1 wzxu wzxu  31K Feb 26  2025 bigwig_chr9_4000000_6000000.bw
-rwxrwxrwx 1 wzxu wzxu 158K Feb 26  2025 bigwig_chr9_4000000_6000000_K562_H3K27ac.bigwig
-rwxrwxrwx 1 wzxu wzxu 240K Feb 26  2025 bigwig_chr9_4000000_6000000_K562_H3K27me3.bigwig
-rwxrwxrwx 1 wzxu wzxu 452K Feb 26  2025 bigwig_chr9_4000000_6000000_K562_H3K4me3.bigwig
-rwxrwxrwx 1 wzxu wzxu 124K Feb 26  2025 bigwig_chr9_4000000_6000000_K562_RNA.bigwig
-rwxrwxrwx 1 wzxu wzxu  62K Feb 26  2025 chr9.1.pc.bedGraph
-rwxrwxrwx 1 wzxu wzxu  20K Nov  4 23:11 chr9.1.pc.bedGraph.bgz
-rwxrwxrwx 1 wzxu wzxu 3.5K Nov  4 23:11 chr9.1.pc.bedGraph.bgz.tbi
-rwxrwxrwx 1 wzxu wzxu  24M Feb 26  2025 cool_chr1_89000000_90400000_for_cmp_1.mcool
-rwxrwxrwx 1 wzxu wzxu  23M Feb 26  2025 cool_chr1_89000000_90400000_for_cmp_2.mcool
-rwxrwxrwx 1 wzxu wzxu  27M Feb 26  2025 cool_chr9_4000000_6000000.mcool
-rwxrwxrwx 1 wzxu wzxu  14M Feb 26  2025 dothic_chr9_4000000_6000000.hic
-rwxrwxrwx 1 wzxu wzxu 9.3M Feb 26  2025 down100.ctcf.pkl
-rwxrwxrwx 1 wzxu wzxu 537K Feb 26  2025 gtf_chr9_4000000_6000000.gtf
-rwxrwxrwx 1 wzxu wzxu  27K Nov  4 23:10 gtf_chr9_4000000_6000000.gtf.bgz
-rwxrwxrwx 1 wzxu wzxu  398 Nov  4 23:10 gtf_chr9_4000000_6000000.gtf.bgz.tbi
-rwxrwxrwx 1 wzxu wzxu 537K Feb 26  2025 gtf_chr9_4000000_6000000_fake.gtf
-rwxrwxrwx 1 wzxu wzxu  34K Feb 26  2025 hg19_ideogram.txt
-rwxrwxrwx 1 wzxu wzxu 6.7K Nov  9 19:37 hg19_ideogram.txt.bgz
-rwxrwxrwx 1 wzxu wzxu 8.5K Nov  9 19:37 hg19_ideogram.txt.bgz.tbi
-rwxrwxrwx 1 wzxu wzxu 2.1K Feb 26  2025 human.hg19.genome
-rwxrwxrwx 1 wzxu wzxu 3.1K Feb 26  2025 make_test_dataset.py
-rwxrwxrwx 1 wzxu wzxu  799 Feb 26  2025 pairs_chr9_4000000_6000000.pairs
-rwxrwxrwx 1 wzxu wzxu  292 Nov  4 23:09 pairs_chr9_4000000_6000000.pairs.bgz
-rwxrwxrwx 1 wzxu wzxu  257 Nov  9 19:55 pairs_chr9_4000000_6000000.pairs.bgz.px2
-rwxrwxrwx 1 wzxu wzxu  606 Feb 26  2025 peak_chr9_4000000_6000000.bedpe
-rwxrwxrwx 1 wzxu wzxu  211 Nov  4 23:11 peak_chr9_4000000_6000000.bedpe.bgz
-rwxrwxrwx 1 wzxu wzxu  222 Nov  9 19:54 peak_chr9_4000000_6000000.bedpe.bgz.px2
-rwxrwxrwx 1 wzxu wzxu 775K Feb 26  2025 snp_chr9_4000000_6000000.snp
-rwxrwxrwx 1 wzxu wzxu  448 Feb 26  2025 tad_chr9_4000000_6000000.bed
-rwxrwxrwx 1 wzxu wzxu  154 Nov  4 23:09 tad_chr9_4000000_6000000.bed.bgz
-rwxrwxrwx 1 wzxu wzxu  140 Nov  4 23:09 tad_chr9_4000000_6000000.bed.bgz.tbi
Compose Frame
CoolBox CLI is designed for compose Frame object by a command chain. The key command of the chain is the add sub-command, It just like the + operator in CoolBox API.
[5]:
%%bash

coolbox add -- --help
NAME
    coolbox add - Add a Element(Track, Coverage, Feature), for example: coolbox add XAxis

SYNOPSIS
    coolbox add ELEM_STR <flags> [ARGS]...

DESCRIPTION
    Add a Element(Track, Coverage, Feature), for example: coolbox add XAxis

POSITIONAL ARGUMENTS
    ELEM_STR
        Element type string. Like BAM, BigWig, Cool ... Full list of Track types can be found here(https://gangcaolab.github.io/CoolBox/quick_start_API.html#Track-types).
    ARGS
        Positional args for create elements.

FLAGS
    Flags are accepted.
        Keyword args for create elements.

NOTES
    You can also use flags syntax for POSITIONAL ARGUMENTS
Here, give a example of draw a figure using CoolBox CLI:
[6]:
%%bash

DIR=../../tests/test_data

coolbox add XAxis - \
add Cool $DIR/cool_chr9_4000000_6000000.mcool - \
add Title "cool" - \
add BAMCov $DIR/bam_chr9_4000000_6000000.bam - \
add Title "bam" - \
add BigWig $DIR/bigwig_chr9_4000000_6000000.bw - \
add Title "bigwig" - \
goto "chr9:4000000-6000000" - \
plot /tmp/test_coolbox.jpg
We have draw a figure and save it to /tmp/test_coolbox.jpg, let’s take a look:
[7]:
from IPython.display import Image
Image(filename='/tmp/test_coolbox.jpg')
[7]:
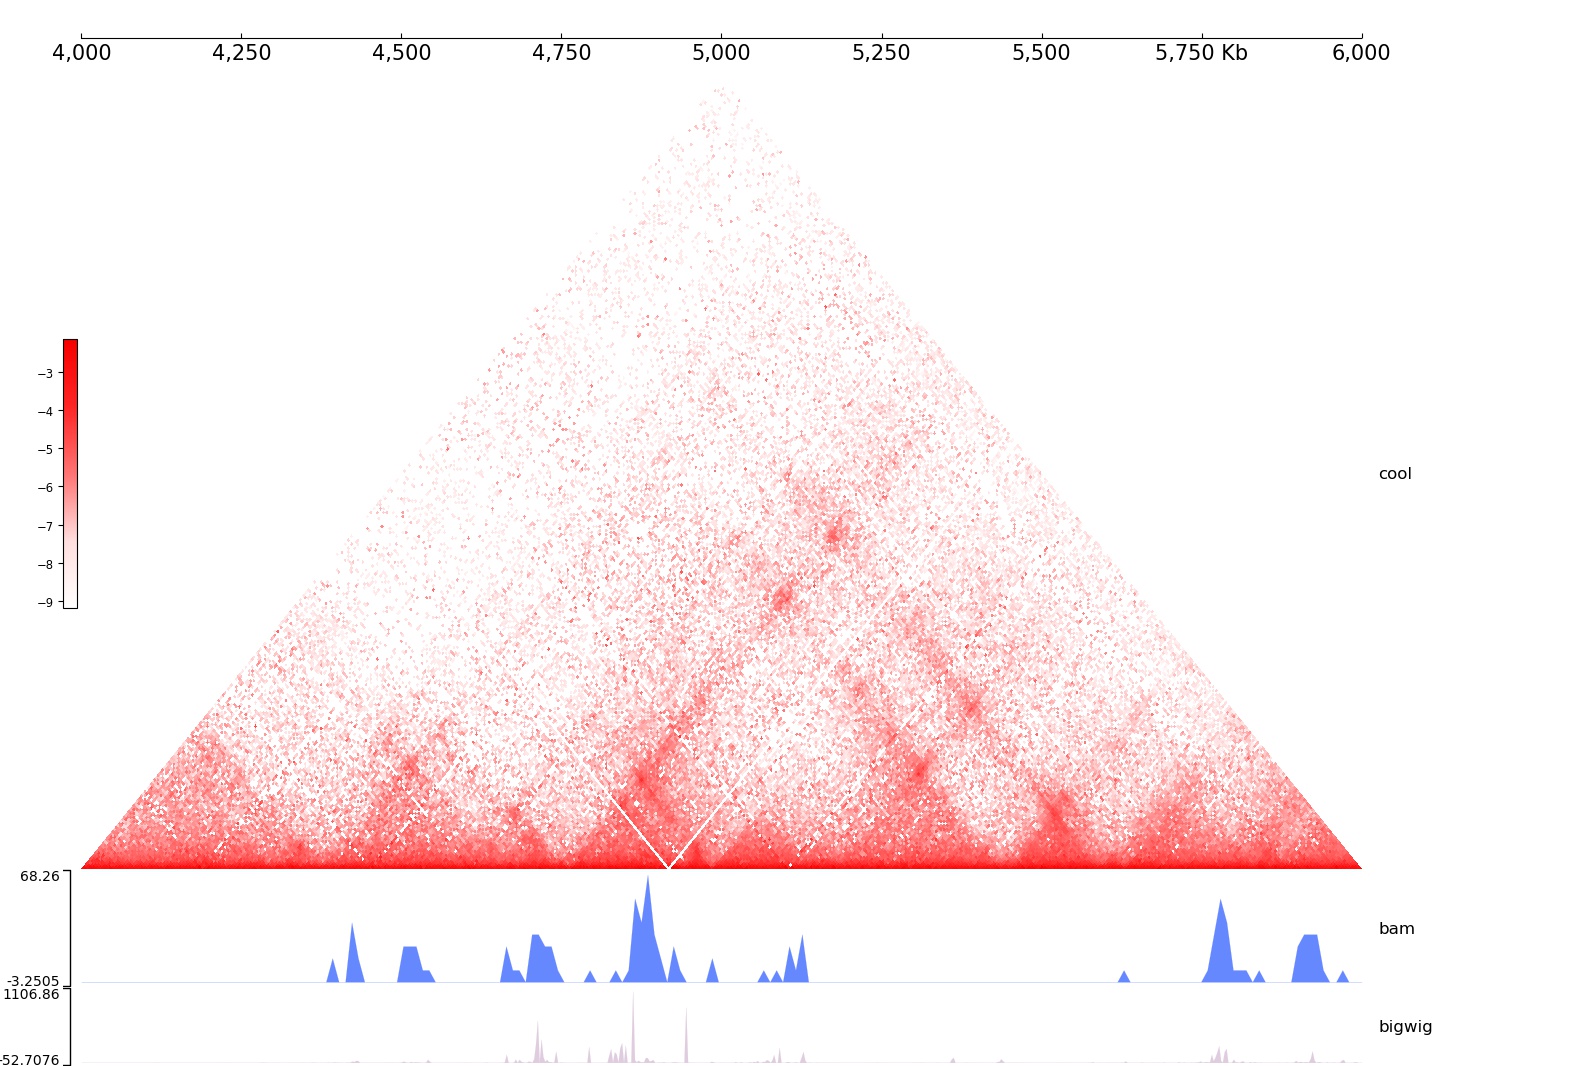
As we can see, we compose our data using the add command, then plot the figure.
The first argument of add is the coolbox element type name. The most frequently used element is the Track, all Track type can be found here
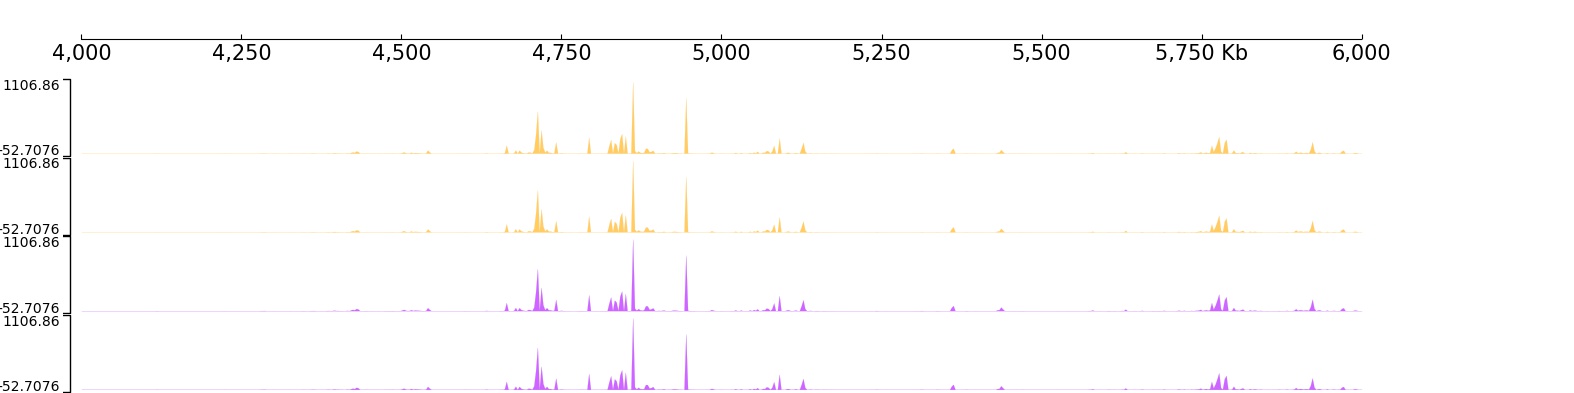
with block
For modify features or add coverage to a group of tracks, you can use the with block, it’s the equivalent of the `with statement in API <https://gangcaolab.github.io/CoolBox/quick_start_API.html#with-statement>`__.
For example modify track’s color:
[8]:
%%bash

DIR=../../tests/test_data

coolbox add XAxis - \
start_with Color "#ffcc66" - \
add BigWig $DIR/bigwig_chr9_4000000_6000000.bw - \
add BigWig $DIR/bigwig_chr9_4000000_6000000.bw - \
end_with - \
start_with Color "#cc66ff" - \
add BigWig $DIR/bigwig_chr9_4000000_6000000.bw - \
add BigWig $DIR/bigwig_chr9_4000000_6000000.bw - \
end_with - \
goto "chr9:4000000-6000000" - \
plot /tmp/test_coolbox.jpg
[9]:
from IPython.display import Image
Image(filename='/tmp/test_coolbox.jpg')
[9]:
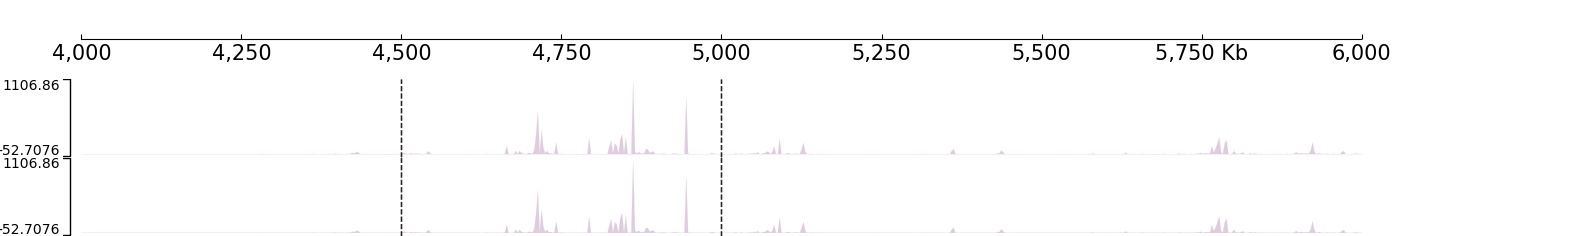
Apply Vlines coverage:
[10]:
%%bash

DIR=../../tests/test_data

coolbox add XAxis - \
start_with Vlines "['chr9:4500000-4500000', 'chr9:5000000-5000000']" - \
add BigWig $DIR/bigwig_chr9_4000000_6000000.bw - \
add BigWig $DIR/bigwig_chr9_4000000_6000000.bw - \
end_with - \
goto "chr9:4000000-6000000" - \
plot /tmp/test_coolbox.jpg
[11]:
from IPython.display import Image
Image(filename='/tmp/test_coolbox.jpg')
[11]:
Start a browser
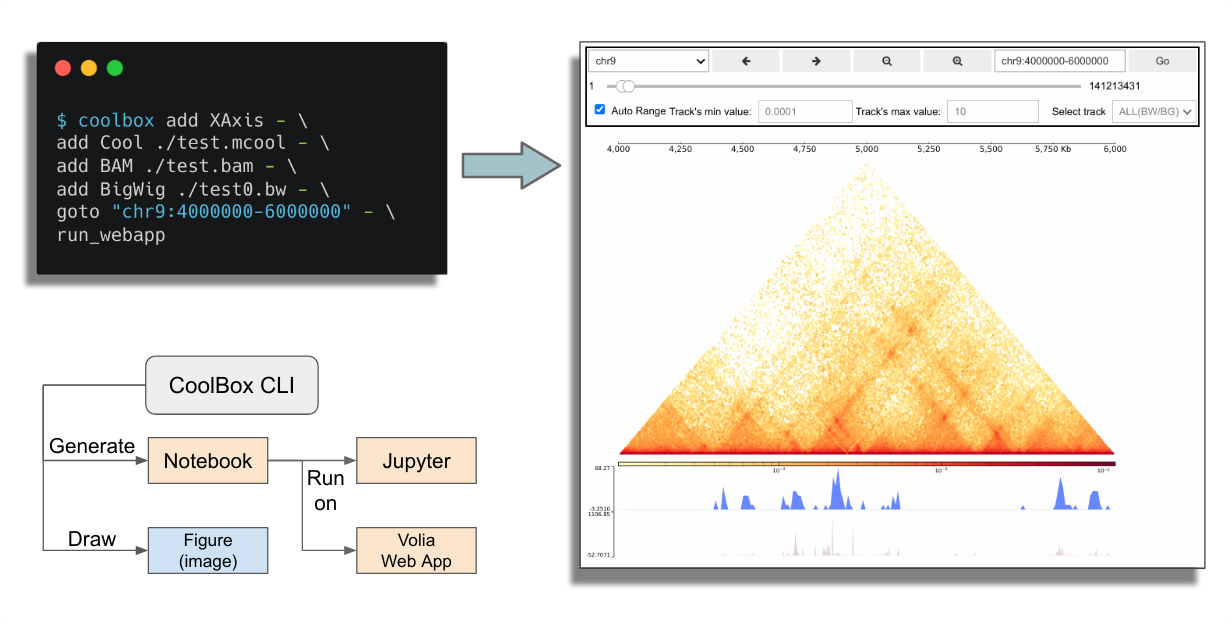
CoolBox CLI can automatically generate a notebook which contain the browser composition code equivalent to using CoolBox API.
And this notebook will be run in Jupyter environment or Volia webapp. Then you can open your web browser to use this GUI to explore your genomic data, for example:
$ coolbox add XAxis - \
add Cool ./tests/test_data/cool_chr9_4000000_6000000.mcool - \
add BAM ./tests/test_data/bam_chr9_4000000_6000000.bam - \
add BigWig ./tests/test_data/bigwig_chr9_4000000_6000000.bw - \
goto "chr9:4000000-6000000" - \
run_jupyter
This will start a jupyter server and run a coolbox browser within the notebook. And you can also to run a independent web app using similar command:
$ coolbox add XAxis - \
add Cool ./tests/test_data/cool_chr9_4000000_6000000.mcool - \
add BAM ./tests/test_data/bam_chr9_4000000_6000000.bam - \
add BigWig ./tests/test_data/bigwig_chr9_4000000_6000000.bw - \
goto "chr9:4000000-6000000" - \
run_webapp
More detail usage see the help info:
[12]:
%%bash

coolbox run_jupyter -- --help
NAME
    coolbox run_jupyter - Create a notebook according to command line, then start a jupyter process.

SYNOPSIS
    coolbox run_jupyter <flags>

DESCRIPTION
    Create a notebook according to command line, then start a jupyter process.

FLAGS
    -j, --jupyter_args=JUPYTER_ARGS
        Default: '--ip=0.0.0.0'
        Arguments for run jupyter.
[13]:
%%bash

coolbox run_webapp -- --help
NAME
    coolbox run_webapp - Run a independent coolbox browser web app. (Create notebook and run voila)

SYNOPSIS
    coolbox run_webapp <flags>

DESCRIPTION
    Run a independent coolbox browser web app. (Create notebook and run voila)

FLAGS
    -v, --voila_args=VOILA_ARGS
        Default: '--Voila.ip=0.0.0.0'
        Arguments for run jupyter.
Load custom module
We can load the custom defined module(.py file) with the load_module command. For example, there are a simple custom defined track in custom_track.py:
[14]:
%%bash

DIR=../../tests/

cat $DIR/custom_track.py
from coolbox.core.track.base import Track


class CustomTrack(Track):
    def __init__(self):
        super().__init__(properties_dict={})

    def fetch_data(self, gr, **kwargs):
        return "Test Custom"

    def plot(self, ax, gr, **kwargs):
        x = gr.start + gr.length * 0.33
        ax.text(x, 0, self.fetch_data(gr), fontsize=50)
        ax.set_xlim(gr.start, gr.end)
We can load it from the file with load_module then use it to draw a plot:
[15]:
%%bash

DIR=../../tests/

coolbox - load_module $DIR/custom_track.py - \
    add XAxis - \
    add CustomTrack - \
    goto "chr1:10000-20000" - \
    plot /tmp/test_coolbox_custom_cli.png
[16]:
Image(filename='/tmp/test_coolbox_custom_cli.png')
[16]:
