Colormaps of Hi-C contact map
[1]:
import coolbox
from coolbox.api import *
[2]:
coolbox.__version__
[2]:
'0.4.0'
[3]:
cool_path = "../../../tests/test_data/cool_chr9_4000000_6000000.mcool"
test_region = "chr9:4300000-5700000"
Matplotlib builtin colormaps
Full colormap list can reference this page.
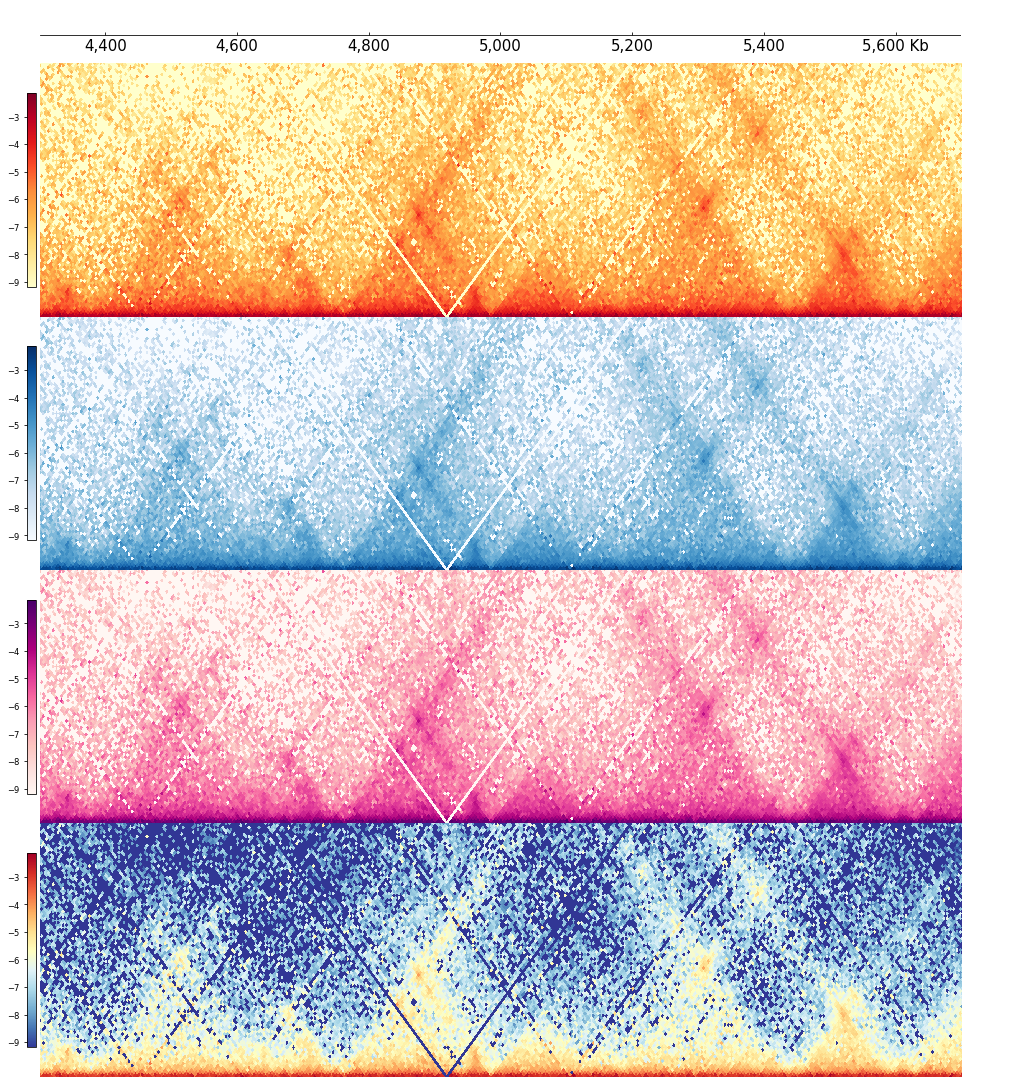
[4]:
with Feature(depth_ratio=0.4):
    frame = XAxis() + \
        Cool(cool_path, cmap="YlOrRd") + \
        Cool(cool_path, cmap="Blues") + \
        Cool(cool_path, cmap="RdPu") + \
        Cool(cool_path, cmap="RdYlBu_r")

frame.plot(test_region)
[4]:
Color maps defined in coolbox
[5]:
from coolbox.core.track.hicmat.plot import cmaps
[6]:
cmaps
[6]:
{'JuiceBoxLike': <matplotlib.colors.LinearSegmentedColormap at 0x77296529c890>,
 'JuiceBoxLike2': <matplotlib.colors.LinearSegmentedColormap at 0x772971414f50>}
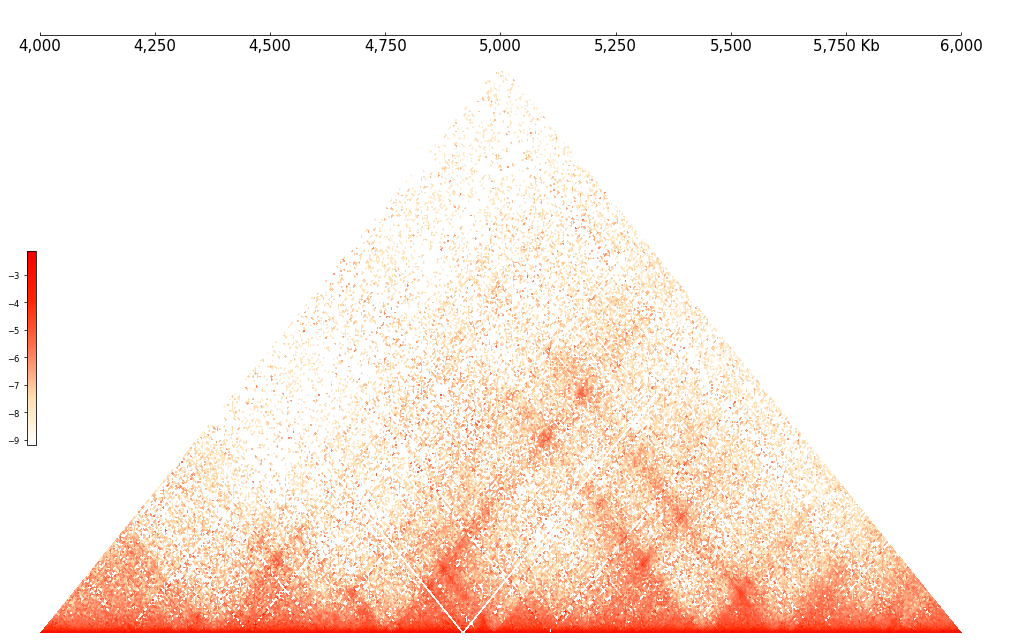
[7]:
frame = XAxis() + \
    Cool(cool_path, cmap="JuiceBoxLike")

frame.plot("chr9:4000000-6000000")
[7]:
Define new colormap with matplotlib
Here, give an example of create cmap using LinearSegementedColormap:
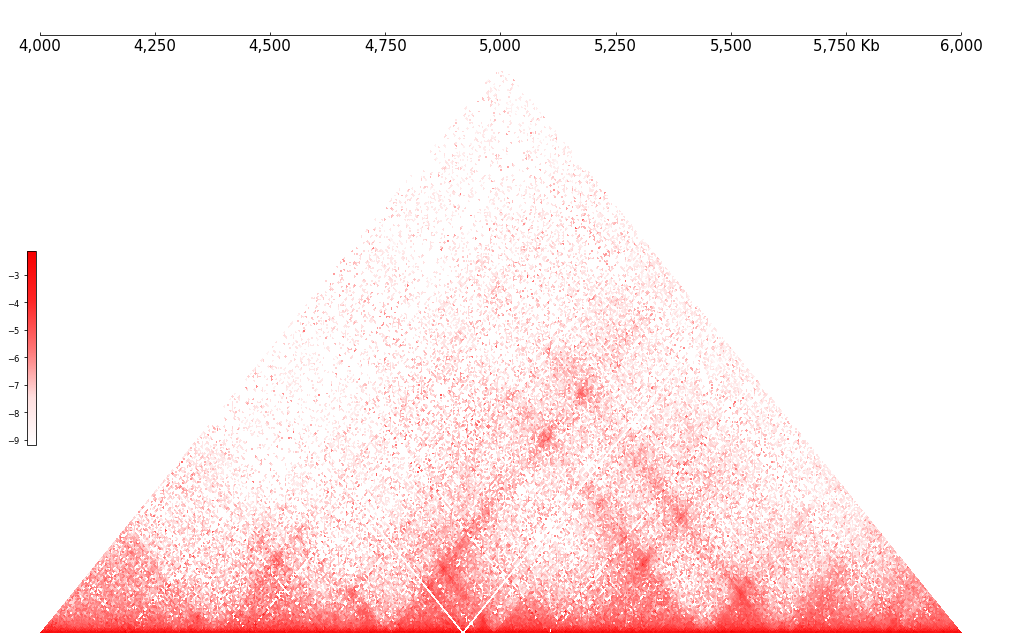
[8]:
from matplotlib.colors import LinearSegmentedColormap

# give a list of color (color gradient)
gradient = ['#FFFFFF','#FFDFAF','#FF7555','#FF2600','#F70000']

my_cmap = LinearSegmentedColormap.from_list('interaction', gradient)
my_cmap.set_bad("white")
my_cmap.set_under("white")
[9]:
frame = XAxis() + \
    Cool(cool_path, cmap=my_cmap)

frame.plot("chr9:4000000-6000000")
[9]: