Hist track styles
[1]:
import coolbox
from coolbox.api import *
[2]:
coolbox.__version__
[2]:
'0.4.0'
Hist track include:
BigWig
BedGraph
1D hic-feature tracks, see this link
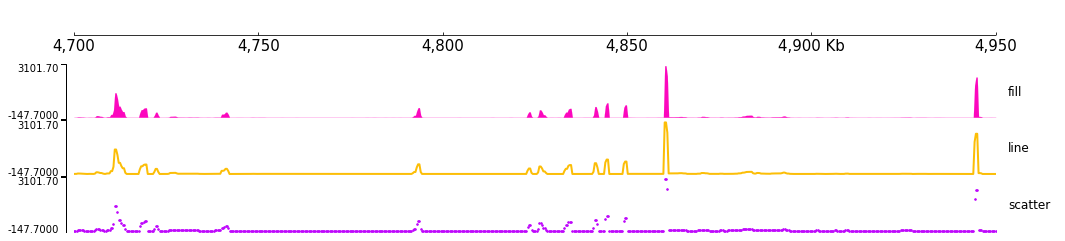
Basic hist styles:
line
fill
scatter
[3]:
bw = "../../../tests/test_data/bigwig_chr9_4000000_6000000.bw"

frame = XAxis() + \
    BigWig(bw, style='fill') + Color("#fc07be") + Title("fill") + \
    BigWig(bw, style='line') + Color("#fcbe07") + Title('line') + \
    BigWig(bw, style='scatter') + Color("#be07fc") + Title('scatter')

frame.plot("chr9:4700000-4950000")
[3]:
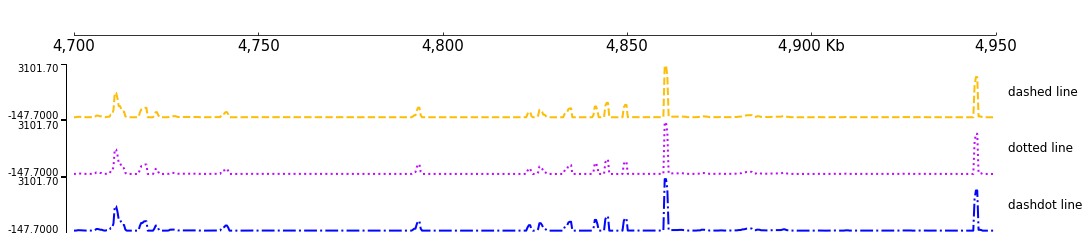
Based on these basic styles, you can use parameters to make some changes, for example use 'fmt' to change line style:
[4]:
frame = XAxis() +\
    BigWig(bw, style='line', fmt='--') + Color("#fcbe07") + Title('dashed line') + \
    BigWig(bw, style='line', fmt=':') + Color("#be07fc") + Title('dotted line') + \
    BigWig(bw, style='line', fmt='-.') + Color("#0007fc") + Title('dashdot line')

frame.plot("chr9:4700000-4950000")
[4]:
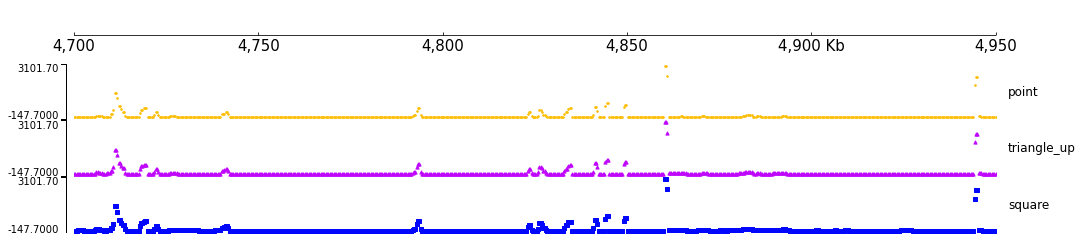
fmt can also used for change scatter marker style:
[5]:
frame = XAxis() +\
    BigWig(bw, style='scatter', fmt='.') + Color("#fcbe07") + Title('point') + \
    BigWig(bw, style='scatter', fmt='^') + Color("#be07fc") + Title('triangle_up') + \
    BigWig(bw, style='scatter', fmt='s') + Color("#0007fc") + Title('square')

frame.plot("chr9:4700000-4950000")
[5]:
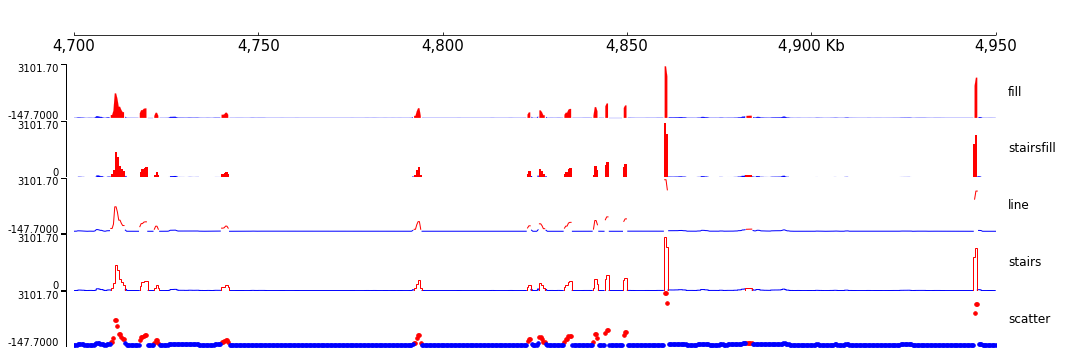
Another useful prameter ‘threshold’ are used for highlight some region:
[6]:
frame = XAxis() +\
    BigWig(bw, style='fill', threshold=100, color="#0000ff", threshold_color="#ff0000") + Title("fill") + \
    BigWig(bw, style='stairsfilled', threshold=100, color="#0000ff", threshold_color="#ff0000") + Title("stairsfill") + \
    BigWig(bw, style='line', line_width=1, threshold=100, color="#0000ff", threshold_color="#ff0000") + Title("line") + \
    BigWig(bw, style='stairs', line_width=1, threshold=100, color="#0000ff", threshold_color="#ff0000") + Title("stairs") + \
    BigWig(bw, style='scatter', size=50.0, threshold=100, color="#0000ff", threshold_color="#ff0000") + Title("scatter")

frame.plot("chr9:4700000-4950000")
[6]:
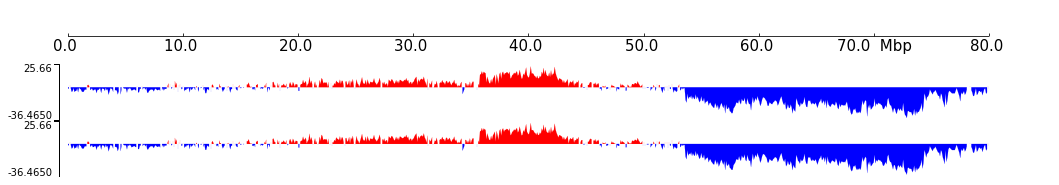
This feature can be used for visualize AB compartment, it’s same to use ABCompartment track
[7]:
ab = "../../../tests/test_data/chr9.1.pc.bedGraph"
frame = XAxis() +\
    BedGraph(ab, style='stairfill', threshold=0, color="#0000ff", threshold_color="#ff0000") + \
    ABCompartment(ab)
frame.plot("chr9:1-80000000")
[7]: